The Covalent GUI#
The Covalent UI is a graphical tool that combines with the Covalent database to store, monitor, visualize, and compare dispatched workflows. Aside from the ability to delete completed dispatches, the UI does not affect the workflows in any way. It is described here as a separate component of the Covalent system because its power to store and visualize the dispatched workflows makes it essential to using Covalent.
The UI’s functionality is documented in The User Interface. This page discusses some of the GUI’s features as they relate to the concepts in The Covalent SDK and Covalent Services.
Dispatches#
The UI dashboard displays a list of all dispatches that have been created by the server, whether they’ve completed or not.
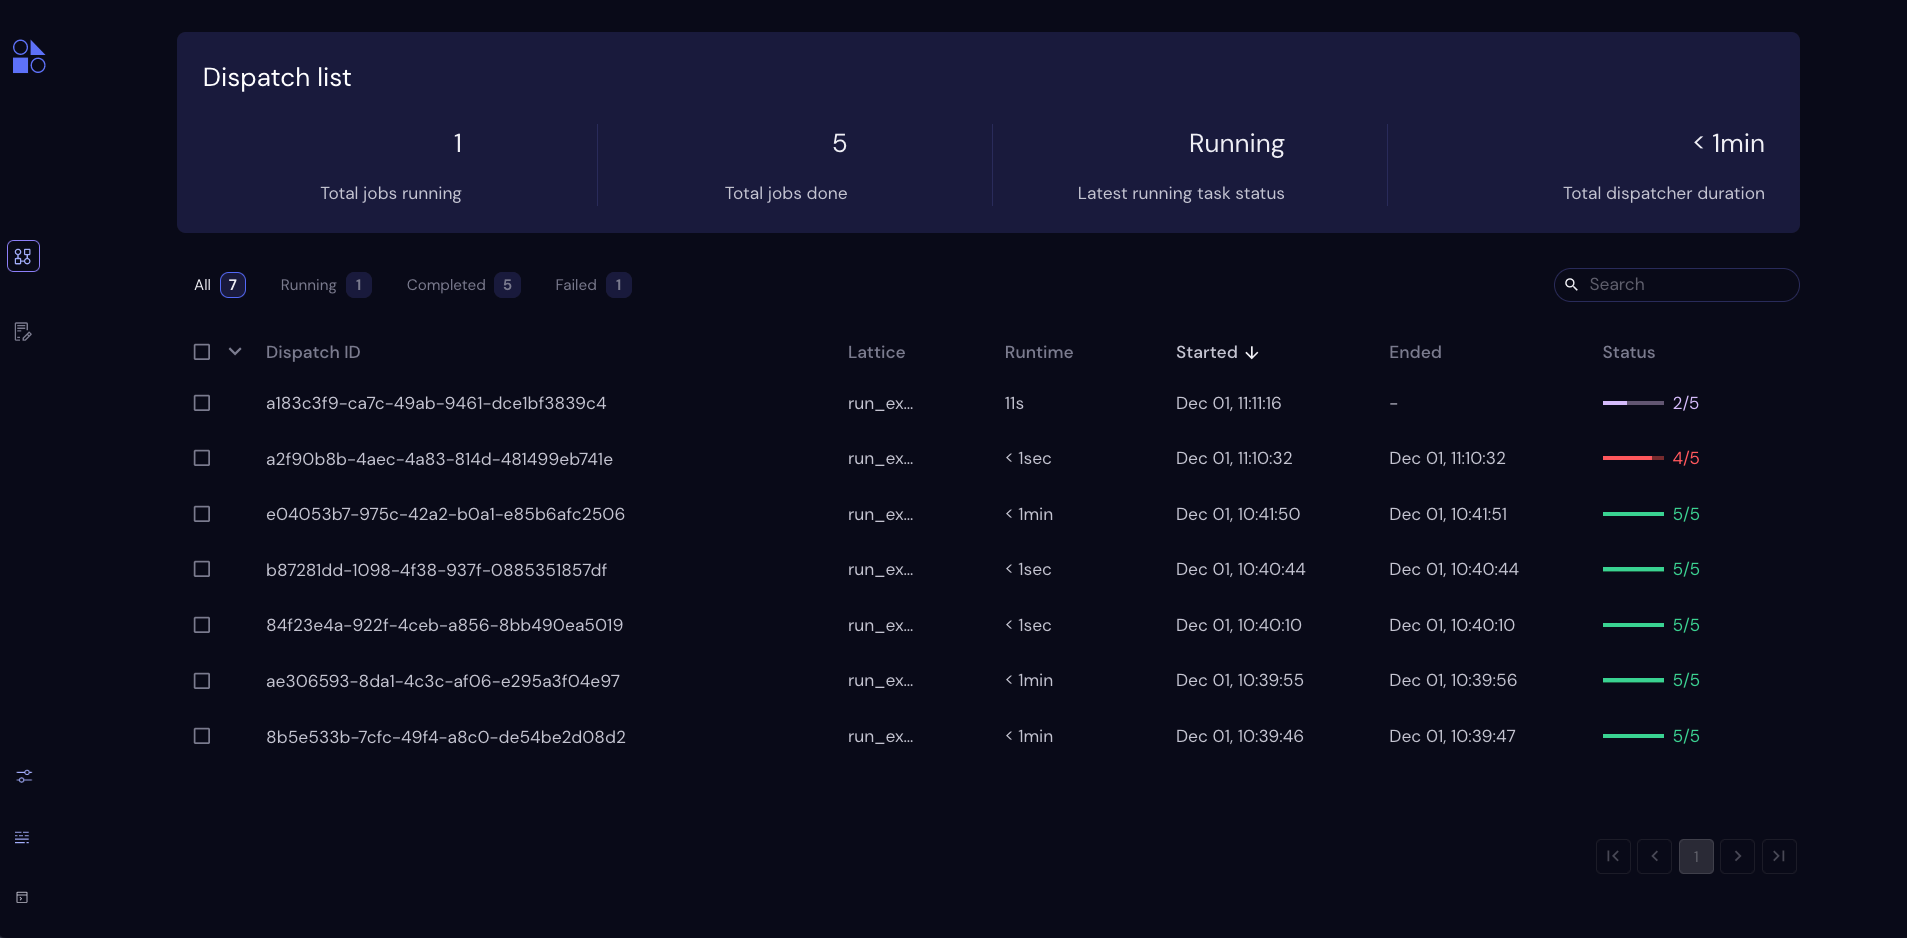
Note that the second workflow in the screen above failed (Status shows 4 of 5 tasks successfully completed), and that the first workflow is still in progress with 11 seconds of runtime and two tasks completed.
Dispatch Status#
The status of each dispatch on the Dashboard is one of the following. Statuses are color-coded in the dispatch list:
- Pending (orange)
Not yet running.
- - Running (white)
Started, with one or more tasks executing.
- - Failed (red)
Stopped. Did not complete successfully because one or more tasks threw fatal errors.
- - Completed (green)
All tasks completed. Result available.
Transport Graph#
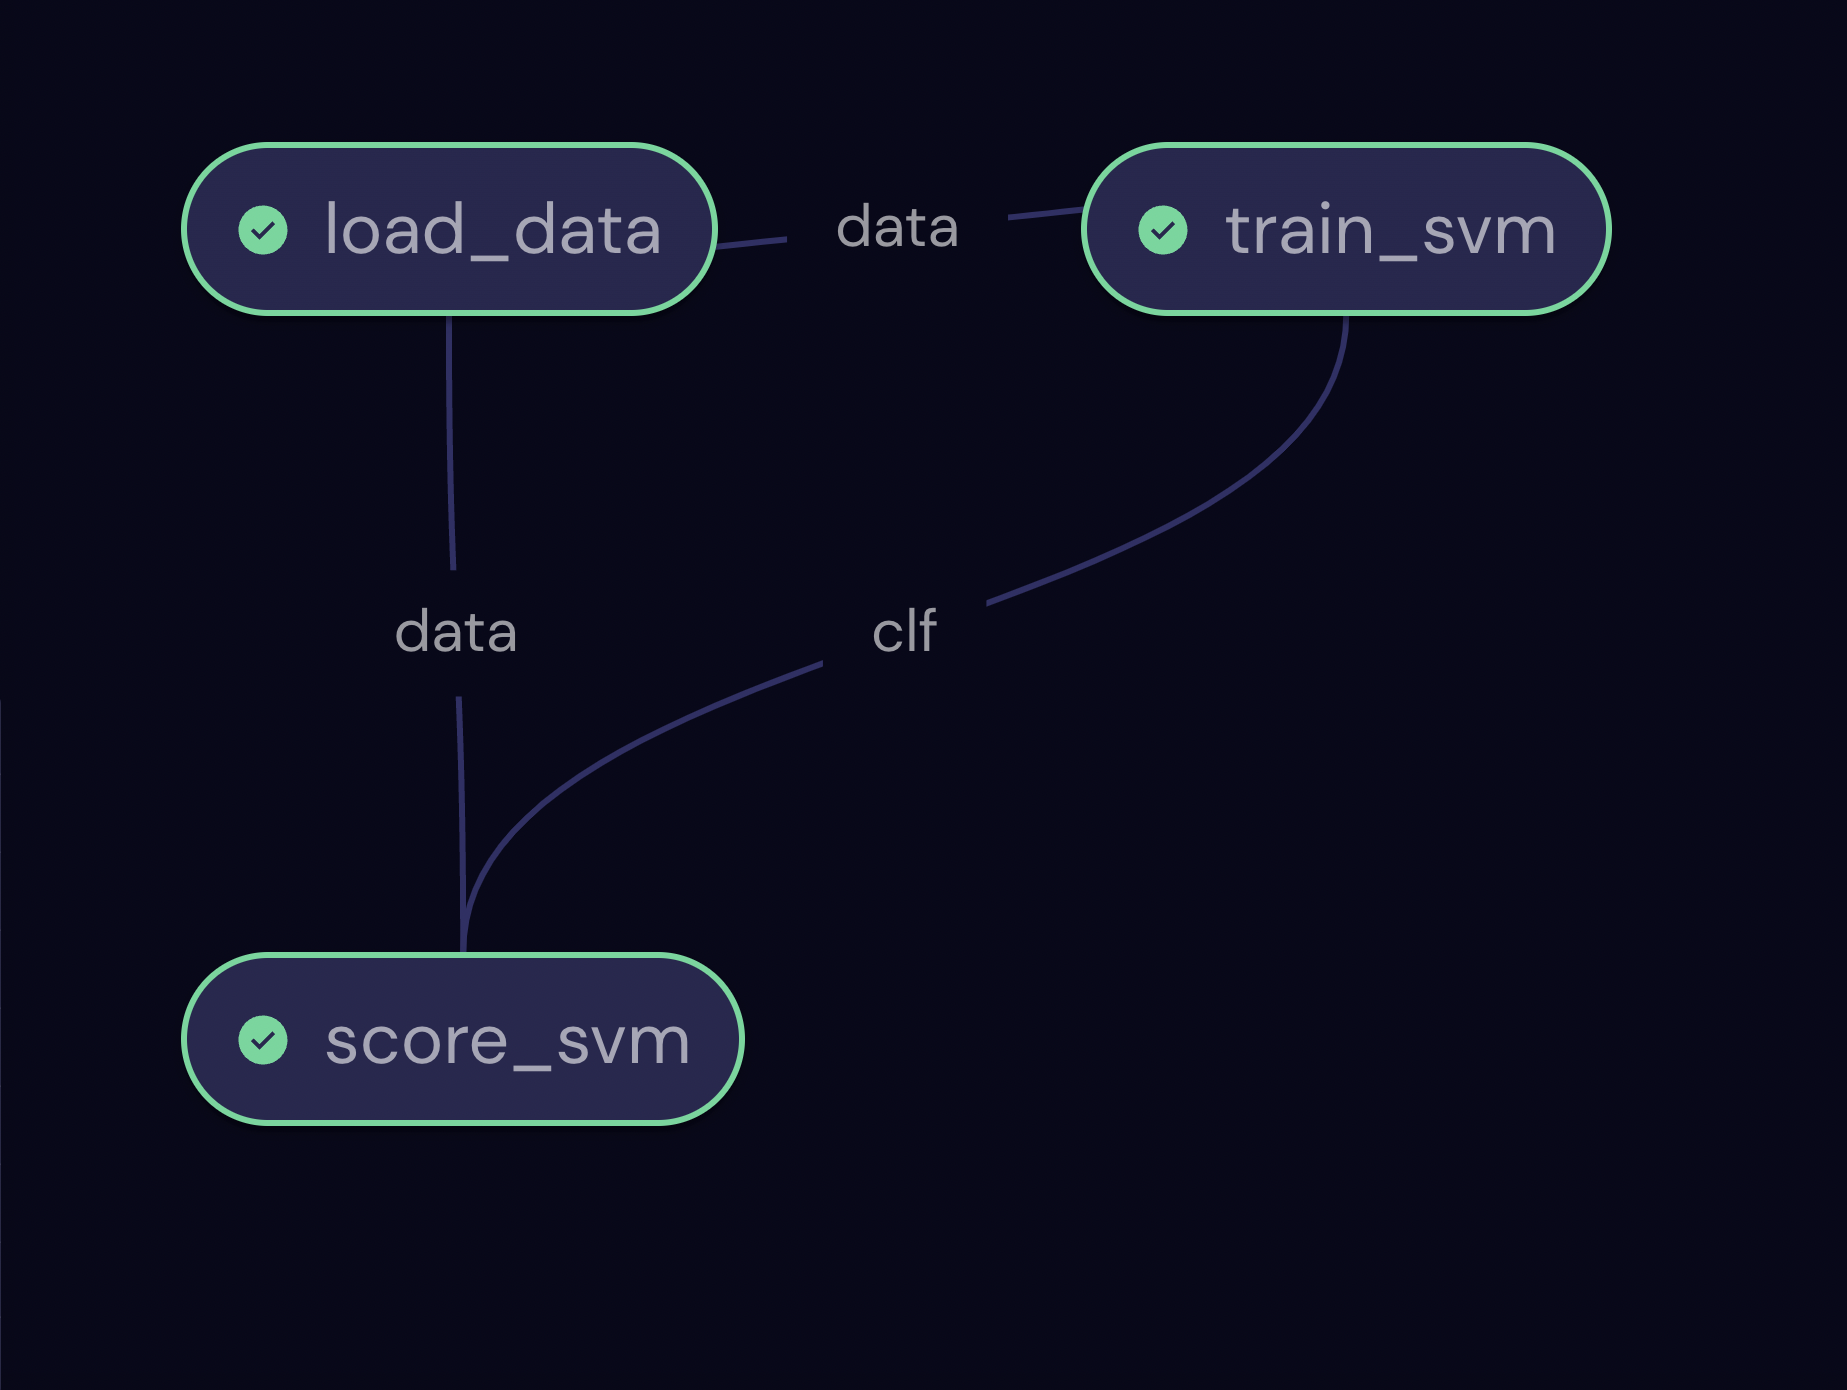
Click on a dispatch ID to view the transport graph. The nodes in the graph shows the executor, name, and ID number of each task. The graph’s edges are labeled with the data dependencies betwen nodes.
Note
In some default display configurations, edges can run behind other nodes, labels can be obscured, and other display anomalies can occur. The graph view features controls that you can use to adjust the graph display.
Below is a transport graph for the machine-learning workflow example.
Note
The node count includes parameters, which (except in rare cases) are counted as successful. To explicitly view parameters in the transport graph, click the P icon in the transport graph icon array.
Transport Graph Nodes#
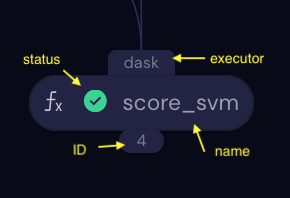
Each electron node in the transport graph shows the following by default:
- Executor
The type of executor to which the electron is assigned.
- Status
An icon indicating the real-time status of the electron. Possible statuses are the same as for dispatches: Pending, Running, Failed, or Completed.
- Name
The name of the function as defined in the Python code.
- ID
A unique (within the dispatch) integer value that can be used to fetch the electron in the SDK.
The Node Dialog#
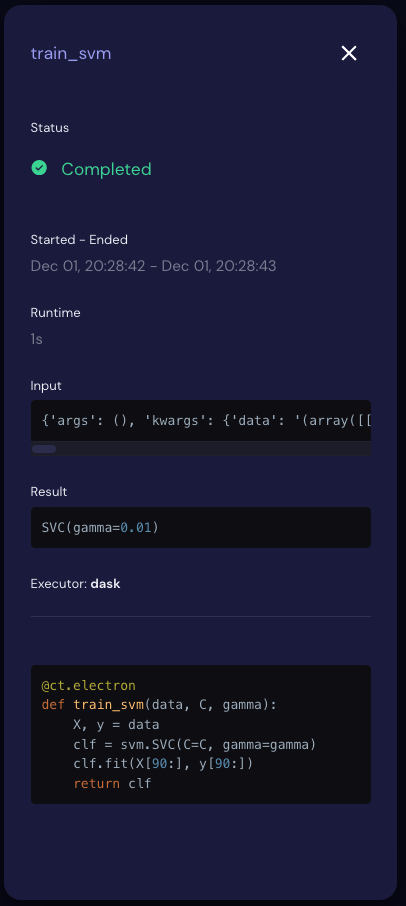
Click on the node to view an informational dialog, as shown here. In addition to what is displayed on the node, the dialog shows this information about the task:
- Started - Ended
The local times at which the task began and finished.
- Runtime
The approximate clock time (not processor time) that the task ran.
- Input
The input arguments to the task function.
- Result
The value or object returned by the task function.
The text box at the bottom of the dialog displays the Python definition the task.